
TADPOLE Challenge Details
Contents
Overview
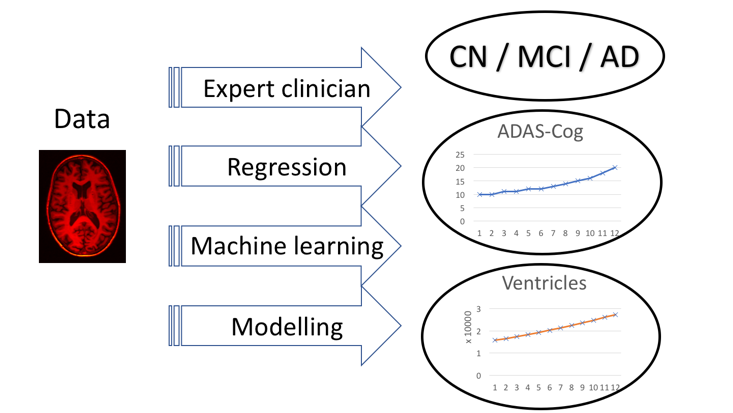
The essence of TADPOLE is very simple. We provide a list of individuals previously recruited to the Alzheimer's Disease Neuroimaging Initiative (ADNI). These individuals have all provided data within earlier ADNI studies and have agreed to provide follow-up data in ADNI 3, which is just starting. ADNI refers to these individuals as "rollovers"; we will use the same term here. You are asked to forecast three features of each rollover individual at the time of their future data provision. Each feature is a common or likely outcome measure for clinical trials:
- Clinical status
CN - Cognitively normal;
MCI - mild cognitive impairment; or
AD - probable Alzheimer's Disease - ADAS-Cog13 score
The ADAS-Cog is frequently used as a primary outcome measure in clinical trials, e.g. Doody et al., NEJM 2014; Salloway et al., NEJM 2014 - Ventricles volume, divided by intracranial volume
As estimated via the standard ADNI image processing pipeline, which uses the FreeSurfer software.
The prizes will go to the participants whose forecasts best match the future data.
Forecasts
Since we do not know the exact time of future data acquisitions for any individual, participants must make month-by-month forecasts for each feature of each individual. Evaluation will use forecasts at the months that correspond to data acquisition.
We expect forecasts to be probabilistic and evaluation metrics will account for forecast probabilities provided by participants. Methods or algorithms that do not produce probabilistic estimates can still participate, by setting binary probabilities (zero or one) and default confidence intervals.
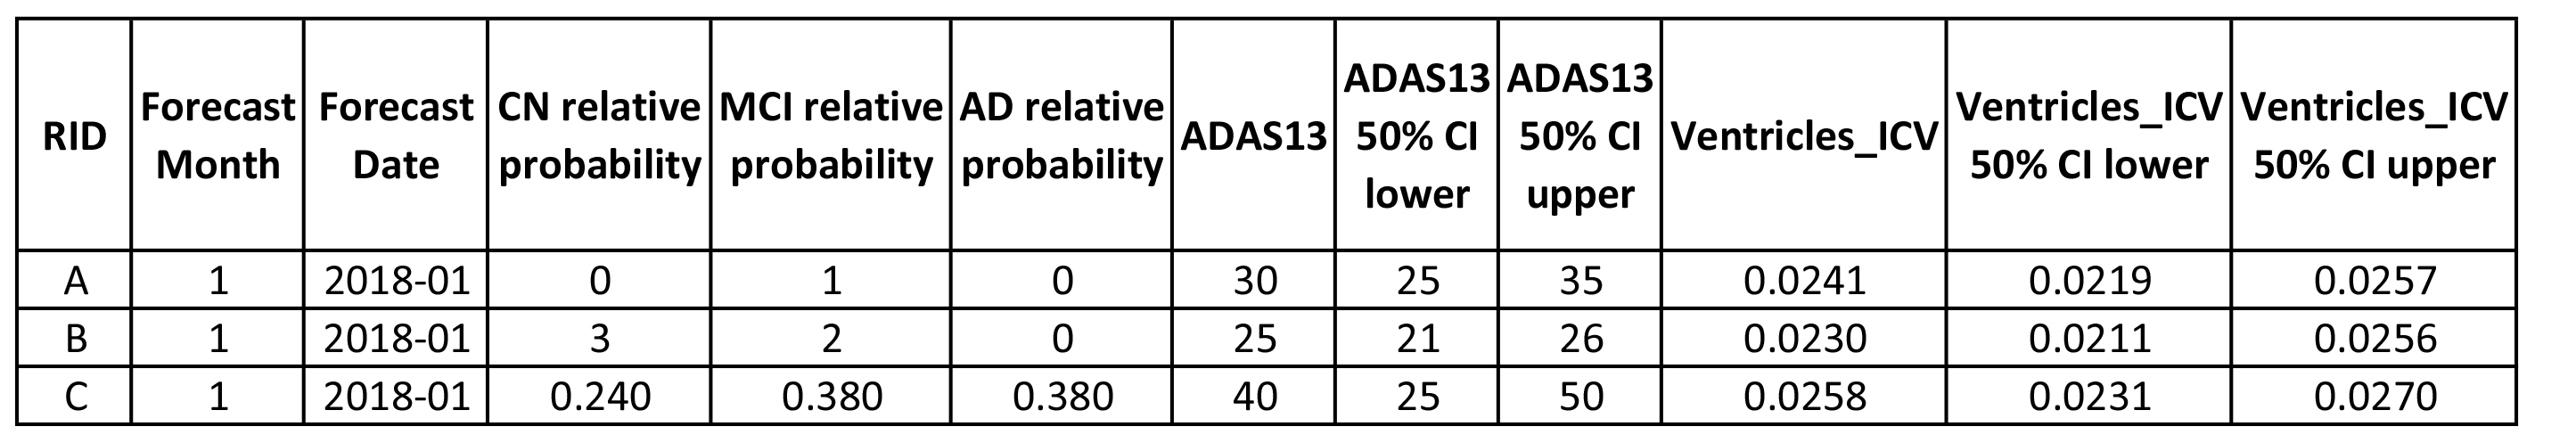
For clinical status, participants will provide a relative likelihood of each option (CN, MCI, and AD) for each individual. For example, relative likelihoods of 1, 2, and 3 for a particular individual in a particular future month mean the participant believes the probabilities pCN, pMCI, and pAD are 1/6, 1/3, and 1/2 for CN, MCI, and AD, respectively, at that future time point. (Negative likelihoods will be set to zero.)
For ADAS-Cog13 and Ventricles volume, the participants provide a best-guess value as well as a 50% confidence interval for each individual. For example, one might forecast ADAS-Cog13 estimates of 30, 25, and 40 for individuals A, B, and C, together with intervals of [25, 35], [21, 26], and [25, 50], respectively. The intervals indicate the participant's confidence in the best guess. Thus, in the example, the participant is most confident in the forecast for individual B (interval size 5) and least confident in that for C (interval size 25). Participants should choose the intervals aiming for a coverage probability of 0.5, i.e. 50% of the best guesses should lie within the corresponding confidence interval.
The table below summarises the format of the forecasts using the examples above.
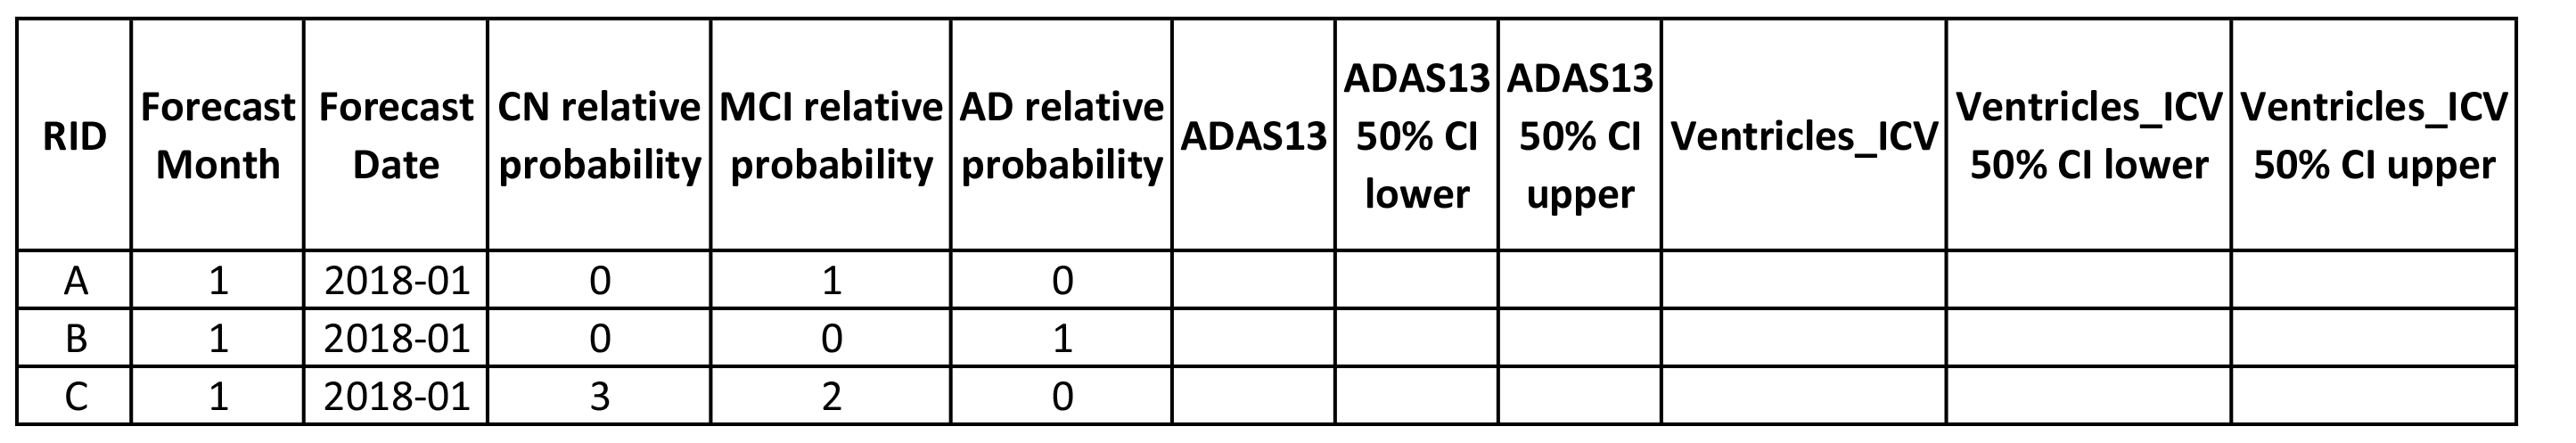
For a simple entry, participants may submit a forecast on at least one of the target biomarkers (clinical status, ADAS-Cog13 score, or ventricle volume), for example:
The actual metrics that TADPOLE will use for forecast evaluation are described in detail in the Performance Metrics tab.
Prizes
Six separate prizes are available. The first four are general categories (open to all participants) and constitute one prize for the best forecast of each feature as well as one for overall best performance:
1. £5K prize for best forecast of future clinical status. Forecasts will be limited to three categories: cognitively normal (CN and SMC in ADNI’s DX field); mild cognitive impairment (EMCI or LMCI); probable Alzheimer’s disease (AD). We will use the multi-class area under the receiver-operating curve (mAUC) – see Performance Metrics tab – as the metric for this prize.
2. £5K prize for best forecast of future ADAS13 score. We will use the mean absolute error as defined on the Performance Metrics tab.
3. £5K prize for best forecast of future ventricle volume. We will use the mean absolute error as defined on the Performance Metrics tab.
4. £5K prize for overall best predictive performance. We will evaluate this as the lowest sum of ranks in the three categories above. This team will be presented as the overall winner of TADPOLE. In the event of a tie, we will use best performance on clinical status prediction (as in prize 1) to decide the winner.
We plan also to include two additional student categories. Thus, for now we will reserve some of the prize fund for two student categories below. However, these awards will depend on engagement from each group and we reserve the right to reallocate the prizes into the general categories instead.
5. £5K prize for the best forecast from a university student team.
6. £5K prize for the best forecast from a high-school team.
Both prizes 5 and 6 will be decided on forecasts of future clinical status only (as in prize 1).
A few conditions are associated with all the awards. We will include some simple forecasts computed by the TADPOLE team. We reserve the right not to allocate prizes to entries that do not outperform these default forecasts. Similarly, if we receive zero or too few entries in one category, we may reallocate that prize to a different category or hold the prize back for evaluation at a later time point.
In all cases, the awards are to support continued work by the team on the topic of AD prediction. The remit of the work is fairly loosely defined and may cover equipment, travel to attend or present at an international conference, lab visits, educational opportunities to learn more about AD research, personnel costs to support the work, etc.
Data sets
The challenge involves three kinds of data set, which we define here before explaining the specific data sets we provide.
For specific details on the training and test data contents and format, see the Data tab.
A training data set is a collection of measurements with associated outcomes, i.e. the targets for forecasting in the challenge are known. Such data can be used to fit models or train algorithms, even human experts, by selecting the parameters that maximise predictions of the known patient outcomes.
A prediction data set contains only baseline measurements, without associated outcome. This is the data that algorithms, models, or experts use as input to make their forecasts of later patient status or outcome.
A test data set contains the patient outcomes against which we will evaluate forecasts. In TADPOLE, this data does not exist at the time of submitting forecasts, but is acquired subsequently and used for evaluation.
The TADPOLE prediction data sets define a list of ADNI rollover individuals for whom forecasts are required. Participants are free to use any data or knowledge to train/design predictive algorithms, models, or other methods, so long as they disclose their methods. This includes the option of using your own custom pipelines/procedures to process raw data (from ADNI or other sources). Similarly, participants are free to use any available information about the rollover individuals to inform their forecasts, subject to disclosure. Nevertheless, since a key feature of the challenge is to evaluate the effect of different methodological choices, we have prepared three "standard" data sets for training and forecasting:
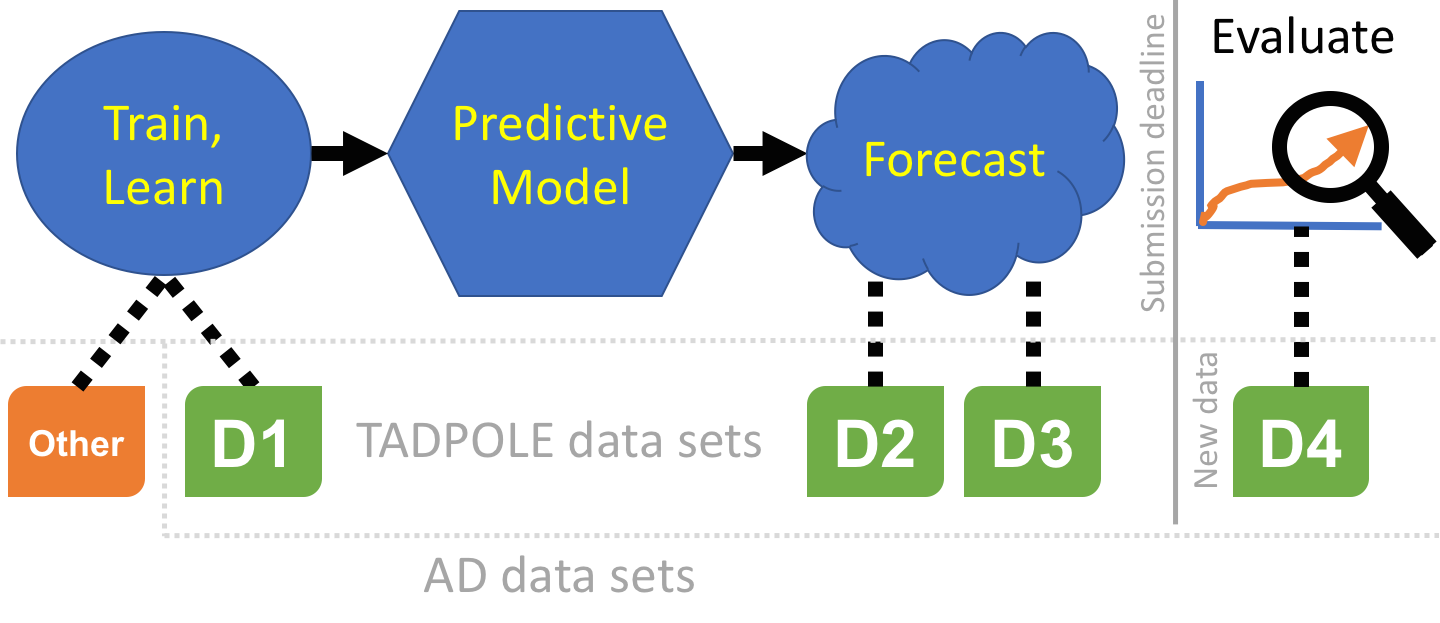
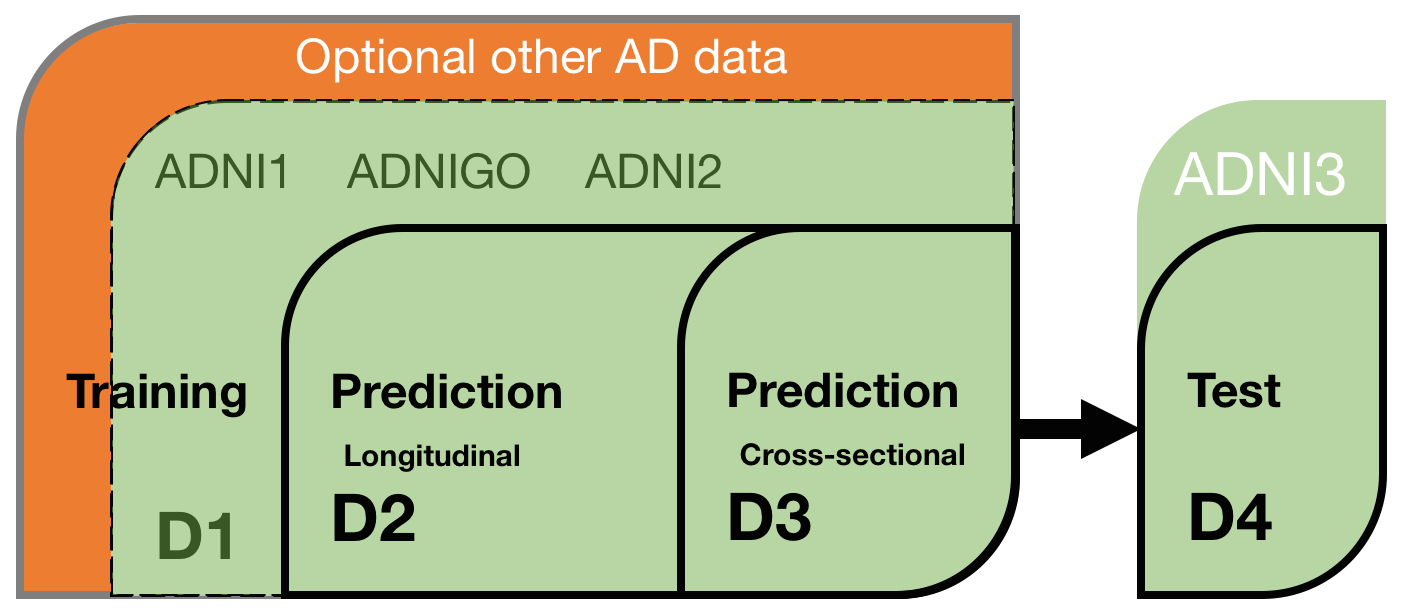
D1 - The TADPOLE standard training set draws on longitudinal data from the entire ADNI history. The data set contains a set of measurements for every individual that has provided data to ADNI in at least two separate visits (different dates) across ADNI 1, ADNI GO, and ADNI 2. It uses ADNI's standard data-processing pipelines to derive the features from various data sources including MR and PET imaging, cognitive tests, CSF biomarkers, and clinical assessment.
D2 - The TADPOLE standard prediction set contains as much available data as we could gather from the ADNI rollover individuals for whom challenge participants are asked to provide forecasts. D2 includes all available time-points for all these individuals. It uses the same data-processing pipeline as the standard training data set D1.
D3 - The TADPOLE cross-sectional prediction set contains a single (most recent) time point and a limited set of variables from each rollover individual (same set of individuals as D2). Although we expect worse forecasts from this data set than D2, D3 represents the information typically available when selecting a cohort for a clinical trial.
As such, earlier data (in D2) from D3 individuals must not be used when forecasting or training/building your models. We appreciate that forecasting from D3 is quite challenging, but expect at least a minimal effort in constructing these forecasts as part of a full entry (see below).
The forecasts will be evaluated on future data:
D4 - The TADPOLE test set will contain data from ADNI3 rollovers, acquired after the challenge submission deadline, and used for evaluating the forecasts according to the TADPOLE Challenge metrics.
Many other open data sets are available that might serve as useful additional training data should participants wish to look at it. For example:
- The Global Alzheimer’s Association Interactive Network (GAAIN),
- Australian Imaging, Biomarker & Lifestyle (AIBL) Flagship Study of Ageing,
- The collection of data sets in the neuGRID for you project,
- Longitudinal data in the Minimal Interval Resonance Imaging in Alzheimer's Disease (MIRIAD) data set.
Submissions
There are two ways to participate. A simple entry requires a minimal forecast and a description of methods; it makes you eligible for the prizes but not co-authorship on the scientific paper documenting the challenge. For consideration as a co-author, you will need to submit a full entry, which requires a complete forecast and a description of methods.
The submission process is similar for simple and full entries. In either case:
- Forecasts should use the template submission spread-sheet (full entry or simple entry) to provide a month-by-month estimate, from January 2018 to December 2022. Please do not alter the format of the template, as the automated evaluation will expect this exact format. Failure to adhere to the format may mean disqualification.
- Each individual TADPOLE challenge participant may contribute to a maximum of three submissions. This is to minimise statistical problems arising from multiple comparisons. Separate groups submitting results from the same methods may be asked to combine if the methods are sufficiently similar. This is simply to avoid gaming the system by dividing a group of researchers working on the same method into separate submission groups. We do not intend to force distinct research teams genuinely working on similar methods to merge.
Simple entries can use any training data or prediction sets they wish and forecast at least one of the target outcome variables (clinical status, ADAS13 score, or ventricle volume). Note that any custom prediction set must include the same set of rollover individuals and only the features can be customised.
Full entries may also use custom training and/or prediction data sets. However, they must also provide forecasts using the standard TADPOLE data sets (D1 for training and separate forecasts using D2 and D3 prediction sets). Prizes will go to the best entries regardless of the choice of training and prediction sets. However, the additional submissions support the key scientific aims of the challenge by allowing us to separate the influence of the choice of training data, post-processing pipelines, and modelling techniques or prediction algorithms/processes. Participants should also note that target variables for evaluation, in particular ventricle volume, will use the same post-processing pipeline as the standard data sets D1-D3.
Please don't cheat when making predictions from D3! There is no benefit to gaming the system in D3 predictions, as winners will be judged on the best overall predictions anyway. D3 predictions are purely for scientific value. If you are making predictions manually, please do so from D3 before looking at D2. If you are using algorithms or models, please be careful not to use information beyond D3 unintentionally (such as earlier data from the same individuals, in D2).
To summarise, each full entry must include forecasts using the standard prediction data sets D2 and D3 (these are different feature sets from the same set of rollover individuals). It may include additional forecasts from "custom" (i.e. constructed by the participant) training data and/or custom post-processing of the subjects in the standard training set. It may also include additional forecasts from custom prediction sets, i.e. a prediction set with different features from the same individuals as in D2 and D3. Thus, a full-entry submission must contain a minimum of two (in the table below, one of 1, 2, 3, 4; and one of 5, 6, 7, 8) and up to a maximum of twelve forecasts:
| ID | Training set | Prediction set |
|---|---|---|
| 1 | D1 | D2 |
| 2 | D1 subject set, custom post processing | D2 |
| 3 | Custom subject set, standard post processing | D2 |
| 4 | Custom subject set, custom post processing | D2 |
| 5 | D1 | D3 |
| 6 | D1 subject set, custom post processing | D3 |
| 7 | Custom subject set, standard post processing | D3 |
| 8 | Custom subject set, custom post processing | D3 |
| 9 | D1 | Custom |
| 10 | D1 subject set, custom post processing | Custom |
| 11 | Custom subject set, standard post processing | Custom |
| 12 | Custom subject set, custom post processing | Custom |
Each of the up-to-twelve forecasts should be in a separate worksheet in the same spreadsheet, as the submission template for full entries indicates.
Methods format
Each submission (simple or full) must include a maximum two-page (A4; 1cm margins; 11pt Arial font) written description of the methods used, that has the format below. A template can be downloaded here.
- Administration details:
Team name, type of team (regular, university student team, school team), contact person, email address, submission type (simple or full), name of the submission file (.xlsx) - Method category:
Choose from: 1) Manual prediction by a clinical expert, 2) Statistical prediction using regression, 3) Machine learning, 4) Data-driven disease progression models or 5) Other (please specify) - Features:
Specify which features (e.g. variables in the D1/D2/D3 spreadsheets) were used. Please detail any additional post-processing. - Feature selection:
Were features selected automatically or manually? Please describe the approach. - Training data set:
Specify what training data was used (D1 only or additional custom training data). - Prediction data set:
Specify what prediction set was used (D2, D3 only or additional custom prediction sets). - Confounder correction:
If yes, please describe what was corrected for and how. - Missing data:
Please explain how your method deals with missing data. - Automatic: Yes/No
Is the final method fully automatic? - Processing time:
How much time does it on average take to make a prediction for one subject? What are computation times and requirements for training? - Prediction method details:
Provide a detailed self-contained description of the prediction method. For a full submission, this should be ready to paste into a journal paper.
TADPOLE timeline
June 2017: Announcement.
15 Jun 2017: Data available and submission system open.
12 Jul 2017: Open webinar 1 on challenge: 14:00 London time (UTC+1).
10 Aug 2017: Open webinar 2 on challenge: 14:00 London time (UTC+1).
15 Aug 2017: Consultation period ends.
14 Sep 2017: Open webinar 3 on challenge: 14:00 London time (UTC+1).
15 Nov 2017: Submission deadline.
Nov 2018: Test set complete.
Jan 2019: Evaluation results on website.
Mar 2019: Publication submitted.
Mar 2019: Review of first phase.
TADPOLE potentially extends to follow-up evaluations at later time-points. We will evaluate the success and impact of the challenge after the first results are published to determine whether follow-up evaluations are valuable.
Pending review evaluation:
Second submission deadline (putative): November 2019.
Second (2-year) evaluation complete: January 2020.
Third submission deadline (putative): November 2020.
Third (5-year) evaluation complete: January 2023.
Organised by: 

Prize sponsors: ![]()
![]()
![]()